Fascinating graphs reveal how highly infectious diseases were all-but wiped out by vaccines
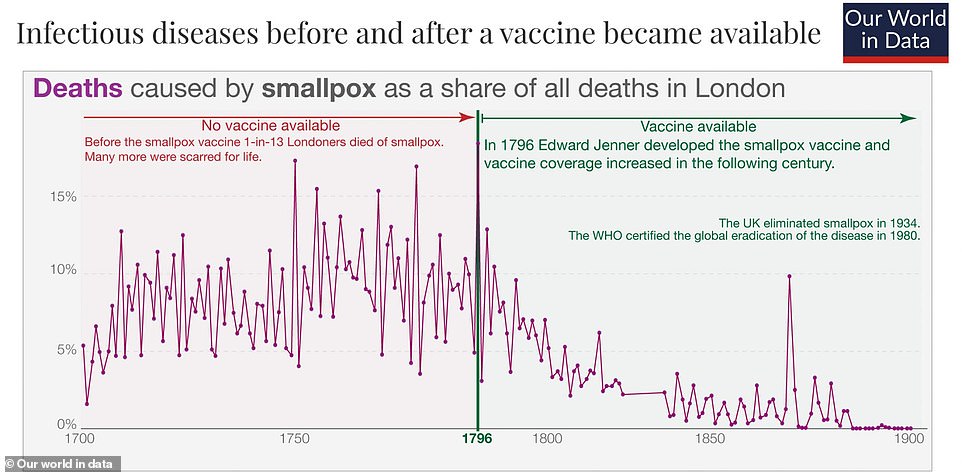
Fascinating graphs reveal how some of the deadliest and most infectious diseases in human history were all-but wiped out after vaccines were developed to fight them. Smallpox, measles and polio together killed hundreds of millions of people throughout human history, while leaving many millions more with life-long disfigurements or disabilities. But with the help of … Read more